
Setting threshold values for metrics on Exadata database servers using DBMCLI

Exadata database servers also allow setting threshold values for metrics, similar to cell nodes, and sending notifications when these thresholds are reached.
With DBMCLI, we can view the defined metrics and their current values on the compute nodes as follows.
DBMCLI> LIST METRICCURRENT
	 DS_BBU_CHARGE exadb01 83.3 %
	 DS_BBU_TEMP exadb01 22.0 C
	 DS_CPUT exadb01 21.8 %
	 DS_CPUT_MS exadb01 0.1 %
	 DS_FANS exadb01 16
	 DS_FSUT / 68%
	 DS_FSUT /boot 12 %
	 DS_FSUT /u01 27 %
	 DS_MEMUT exadb01 93 %
	 DS_MEMUT_MS exadb01 0.3 %
	 DS_RUNQ exadb01 16.9
	 DS_SWAP_IN_BY_SEC exadb01 0.0 KB/sec
	 DS_SWAP_OUT_BY_SEC exadb01 0.0 KB/sec
	 DS_SWAP_USAGE exadb01 0 %
	 DS_TEMP exadb01 19.0 C
	 DS_VIRTMEM_MS exadb01 685 MB
	 N_HCA_MB_RCV_SEC exadb01 235 MB/sec
	 N_HCA_MB_TRANS_SEC exadb01 94.133 MB/sec
	 N_IB_MB_RCV_SEC HCA-1:1 106 MB/sec
	 N_IB_MB_RCV_SEC HCA-1:2 129 MB/sec
	 N_IB_MB_TRANS_SEC HCA-1:1 47.552 MB/sec
	 N_IB_MB_TRANS_SEC HCA-1:2 46.580 MB/sec
	 N_IB_UTIL_RCV HCA-1:1 3.2 %
	 N_IB_UTIL_RCV HCA-1:2 3.9 %
	 N_IB_UTIL_TRANS HCA-1:1 1.4%
	 N_IB_UTIL_TRANS HCA-1:2 1.4 %
	 N_NIC_KB_RCV_SEC exadb01 1,454 KB/sec
	 N_NIC_KB_TRANS_SEC exadb01 2,161 KB/sec
We can check if there are threshold values for the defined metrics as follows.
DBMCLI> list threshold detail
	 name: DS_FSUT
	 comparison: >
	 Critical: 90.0
	 Warning: 70.0

	 name: DS_MEMUT
	 comparison: >
	 Critical: 90.0
	 Warning: 70.0
In the output above, a warning will occur when the DS_FSUT and DS_MEMUT metrics reach 70%, and a critical condition will occur when they reach 90%. When the threshold values are reached, entries will be created in alerthistory as shown below, and if SMTP settings have been configured via dmcli, email alerts will be sent.
DBMCLI> list alerthistory
	 1_1 2018-08-02T13:40:26+03:00 warning "The warning threshold for the following metric has been crossed. Metric Name : DS_FSUT Metric Description : Percentage of total space on this file system that is currently used Object Name : / Current Value : 68.0 % Threshold Value : 50.0 % "
	 1_2 2018-08-02T13:42:26+03:00 clear "The warning threshold for the following metric has been cleared. Metric Name : DS_FSUT Metric Description : Percentage of total space on this file system that is currently used Object Name : / Current Value : 68.0 % Threshold Value : 70.0 % "
	 2_1 2018-08-02T14:29:26+03:00 critical "The critical threshold for the following metric has been crossed. Metric Name: DS_MEMUT Metric Description: Percentage of total physical memory on this server that is currently used Object Name: exadb01 Current Value: 96.0 % Threshold Value: 90.0 % "
The email notification is as follows:
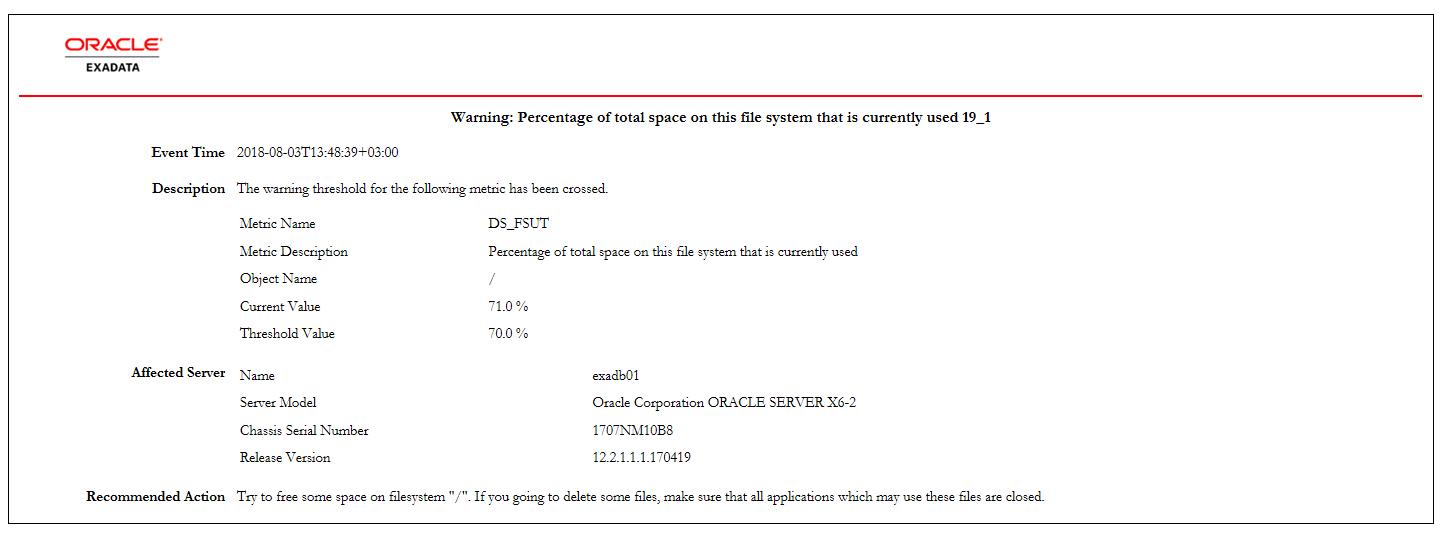
You can set a new threshold value below. In the example, a warning threshold is set when the file system usage rate reaches 50%, and a critical threshold is set when it reaches 90%.
DBMCLI> CREATE THRESHOLD DS_FSUT comparison='>',warning=50,critical=90
Threshold DS_FSUT successfully created
To change the defined threshold value,
DBMCLI> alter THRESHOLD DS_FSUT comparison='>', warning=70
Threshold DS_FSUT successfully altered
You can see the changes as follows.
DBMCLI> list threshold detail
	 name: DS_FSUT
	 comparison: >
	 Critical: 90.0
	 Warning: 70.0
Threshold values can be set for all defined metrics.
![]()